Mar 2024
Mar 2024
Weekly roundup for StoneX Bullion
By StoneX Bullion
Gold enjoyed a much-needed correction and unwound its overbought condition
While silver kept moving higher
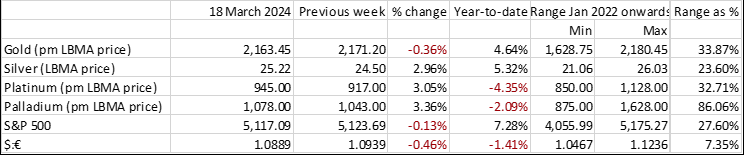
Since 29th February gold is now up 6.2% and silver by 12.2%; That’s more like it!
Heavy buying in COMEX gold and silver in the week to 12thMarch; strong short covering in silver
Outright long gold and silver positions pose large overhangs in the marketa
Medium-term geopolitics are a strong tailwind but there are chances of a short term retreat
Gold has entered a period of much-needed correction, while silver gathered some upward momentum last week. Gold thus retraced from $2,180 to $2,150; silver moved from $24.46 to test $25.50 before a minor correction.
The background factors include the following: -
- Increasing belief that the Fed will not only not cut next week, but may only implement two rate cuts this year rather than the generally accepted three
- This has been fuelled by the month-on-month January PCE Deflator gain of 0.3%, after 0.1% in December and zero in both October and November
- The Producer Price Index, released in the middle of last week, was up 0.6% in February month-on-month and has been eking out a steady upward trend in recent months, which certainly underlines persistent caution from the Fed
US PPI monthly changes, ten-year view
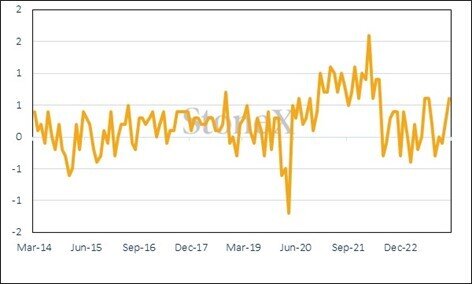
Source: Bloomberg, StoneX
- Is it certainly possible that the gold:silver ratio was being traded last week, especially as it broke down below the 10-day moving average and then the ten-day crossed below the 20-day.
Gold, silver and the ratio
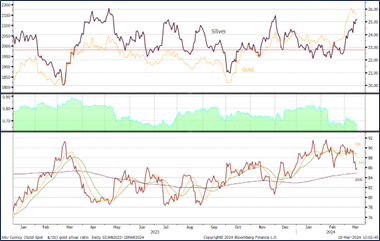
Source: Bloomberg, StoneX
In the background the rise in two-year US yields on waning rate cut expectations helped to take some of the steam out of gold’s move at the start of last week, but don’t forget that gold was heavily overbought above $2,180 (the intraday peak was $2,195) while market participants were also awaiting the PPI and, on Tuesday, the CPI. The CPI number was, at 0.4% month-on-month, up from January (0.3%) and continuing a gradually rising trend, while the year-on-year change was 3.2%, up from 3.1% and this helped to turn gold lower. The PPI number the following day accelerated this momentum, overpowering the potentially supportive retail sales numbers, which were below expectations.
Silver, meanwhile, had developed its own independent momentum, driven to a large extent by investor activity and momentum trades before it, too, ran out of steam just below $25.50; at time of writing on Monday 18th, silver is sitting on the $25.00 level.
The majority of this recent activity in both gold and silver has come from the investor fraternity. Regional retail demand for gold has weakened in the face of these price rises and ETP’s have continued to shed metal although there has been some sporadic interest, while physical coin and bar demand has slowed right down.
We expect gold to remain strong given the continued geopolitical tensions around the world and the fact that the Fed, will, eventually, change its rate cycle. The most interesting element this week will be the outcome of the Federal Open Market Committee meeting on Wednesday, including the Special Economic Projections from the Committee and the dot plot (which shows where each Committee Member expects the median fed funds target rate to be at the end of this year, end of next year, and further out). It is likely to be softer than the December profile (below) but may well not be as soft as the markets had been projecting.
The Fed December Dot Plot
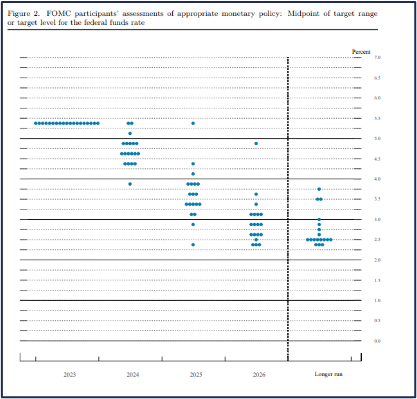
Source: Federal Reserve Board
Swap rates fed funds projection
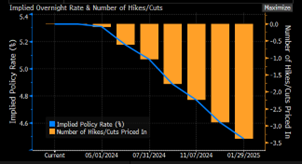
Source: Bloomberg
Gold; year to date
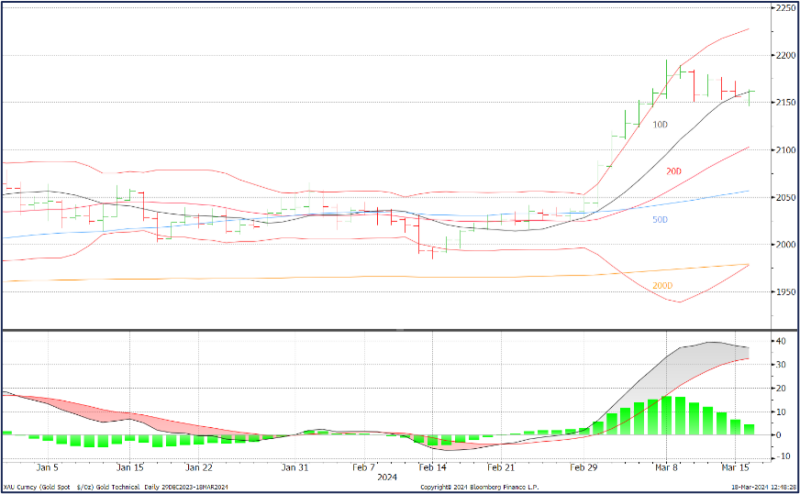
Source: Bloomberg, StoneX
Gold (inverted) and the two-year and ten-year yields, January 2023 to date
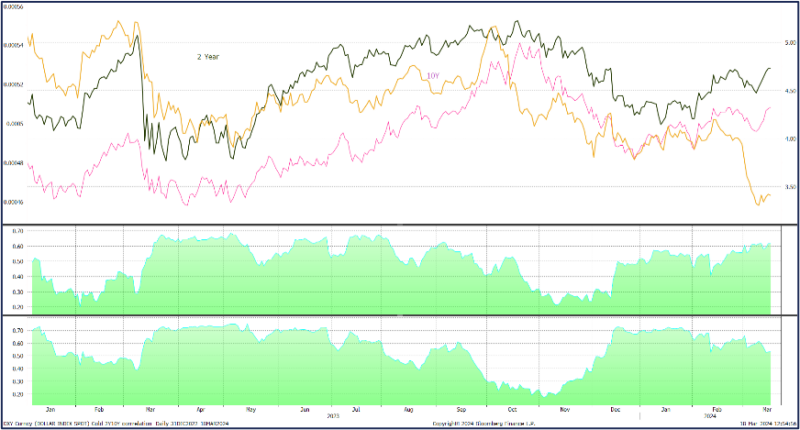
Source: Bloomberg, StoneX
Gold, silver, copper and silver’s correlation with each
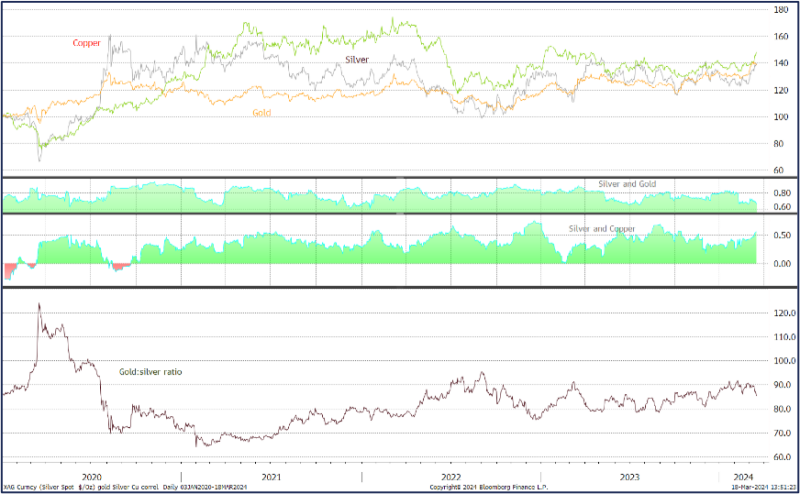
Source: Bloomberg, StoneX
In the background the change in Commitments of Traders in the week to 12th March saw a massive swing in net long positions with outright longs adding a further 20% (90t) while the shorts added 8t (7%), with the net long rising to 439t against a 12-month average of 233t. The outright long position means that gold is vulnerable to short term profit taking (indeed we have already seen some), given that the 12-month average was 398t and the outright long position, at 541t, was the highest since 8th March 2023.
Silver added 12 (798t) on the long side and shorts were down by another huge chunk, losing 967t (23%) to 3,171t to take the net long to 4,146t against a 12-month average of 4,506t short. Here, too, the long position overhang is a potential threat to the upside, standing at 7,318t, the highest since late last November and compared with a 12-month average of 5,950t.
Amongst the Exchange Traded Products, the latest figures from the World Gold Council (to 15th March) showed a drop of 127t year-to-date to 3,118t. The largest drop, in both tonnage and percentage terms, is of 65.0t or 4.0%, in North America; European Products shed 3.3% or 46.1t. Asia has posted small gains of 3.4% or 4.5t.
Silver ETPs have also been under pressure. There has been some scattered buying interest – occasionally in sizeable tonnage, such as the 607t on 11th March as silver moved up towards $24.50, with the result that the first half of March saw a net increase of 216t. The year-to-date decline has thus contracted to just 45t, to 21,725t (world mine production is approximately 26,500t).
Short-term outlook; likely downside correction in both metals. Longer-term; further upside potential for both.
Silver technical; moving averages becoming more supportive
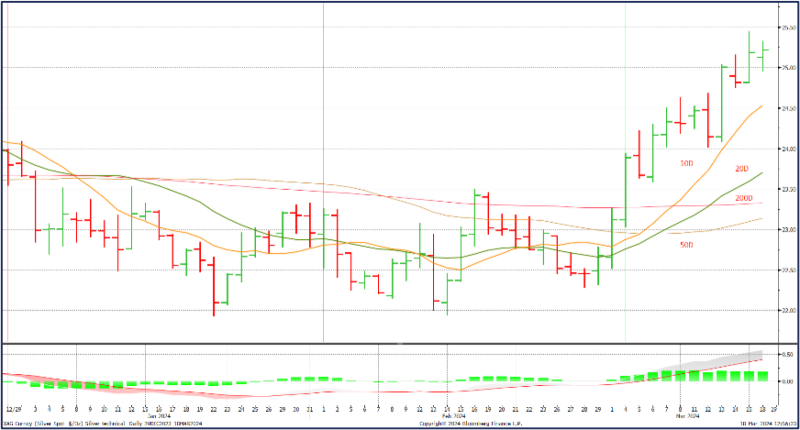
Source: Bloomberg, StoneX
Gold COMEX positioning, Money Managers (t)
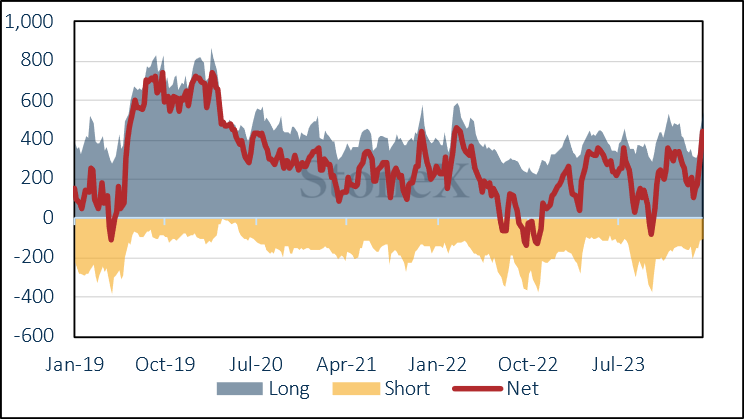
Source: CFTC, StoneX
COMEX Managed Money Silver Positioning (t)
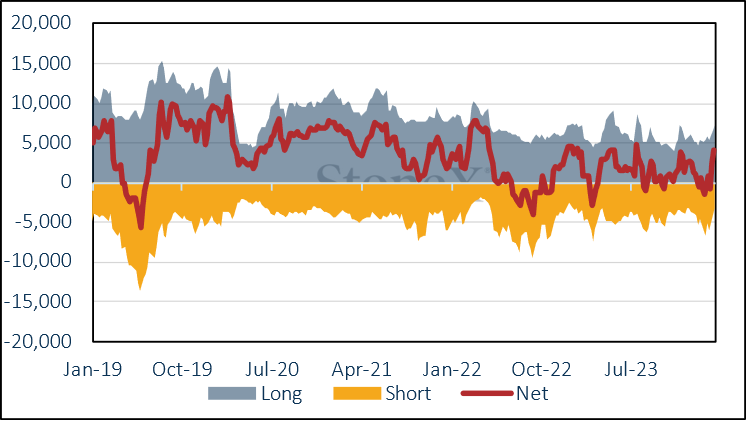
Source: CFTC, StoneX
Source: Bloomberg, StoneX