Jul 2020
Jul 2020
Weekly markets round-up for StoneX Bullion
By StoneX Bullion
Welcome to a very brief overview of the recent performance in the markets. The essentials are captured in the table below and each week we will show a chart of interest.
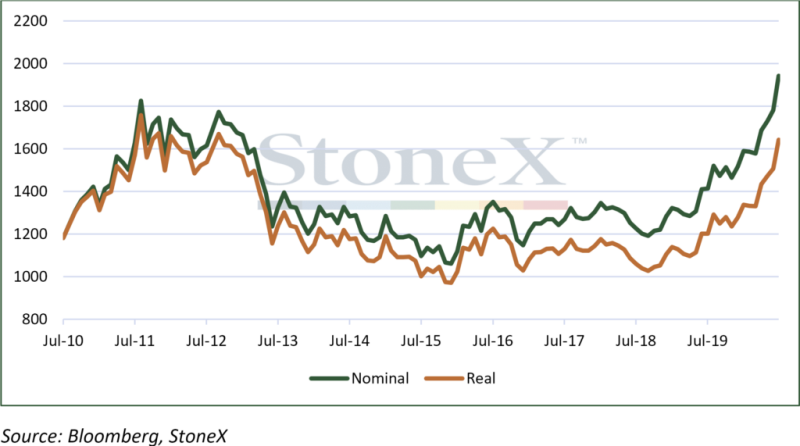
Note that while gold has made all-time highs this week, in real terms (deflator: U.S. CPI) it is not yet at record. That accolade goes to the monthly average of August 2011 and we are still 7% below that level.
We wrote last week that gold’s gradual upward movement made it more robust than if it were to spike; well now it is spiking! There is nothing new to have driven prices to these new all-time highs. The tailwinds are well-documented; the price had already, before the COVID pandemic developed, been in an upward trend based on negative real interest rates, “traditional” geopolitical uncertainties in areas of the Middle East; and less “traditional”, but arguably more influential, geopolitical tensions between the United States and China over trade negotiations. These had taken gold from a range based on $1,300 in the first half of 2019 into a change based off $1,500 in the second half year. The combination of brewing economic uncertainty centred to a fair degree on the U.S.-China tensions meant that the price-elastic demand sector of the market, essentially the Middle East and the whole of Asia, took much longer to adjust to higher prices than is normal (usually only a matter of a few weeks). In fact, these markets had not resumed any meaningful demand at all by the time the virus appeared, and they are still more or less moribund, even with yet more selling coming from some areas.
With the professional and private investment in the western hemisphere taking off over the latter part of the year and accelerating this year, the gold price has been driven higher as the metal has increasingly emphasised its role as a hedge against risk. All the above tailwinds have stayed with us (and geopolitical tensions have spread) and have been joined by increasing concerns not only over the outlook for containment, let alone eradication, of the virus, and the economic and financial ramifications, quite apart from the human tragedy. As part of all this, of course, is the massive injections of liquidity into the world’s major economies in an attempt to stave off disaster, including the long-delayed agreement in Europe last week over the €750Bn recovery fund. In the near term at least, some of this liquidity, which would normally be regarded as excessive, is finding its way into the equity markets, and no doubt into gold., especially as the dollar continues to slide out of favour.
There will come a time when the equity markets correct, and it may well be another violent down leg, quite possibly stronger than the last one and this is also fuelling gold purchases as a hedge against risk. When this happens, do not be surprised if gold comes down also. It usually does, as it is cashed into aid distress and to help raise cash against possible margin calls. It did so in the first quarter of this year, but only falling to four-month lows and rapidly unwinding those losses.
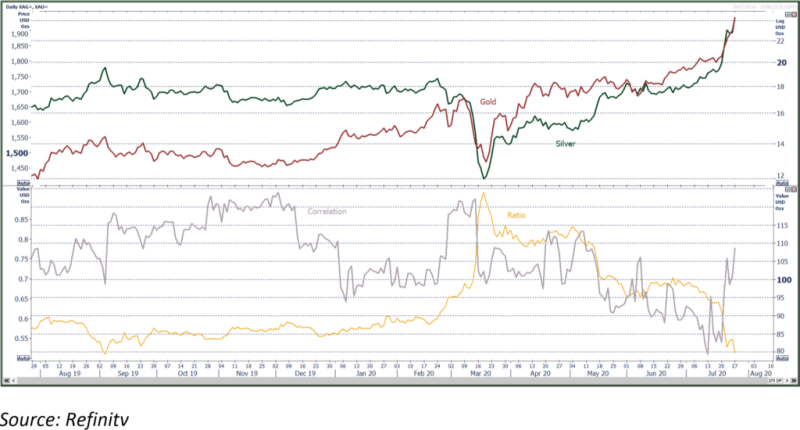
Such a move would be unlikely to end the bull market, however. That is most likely to happen when the markets have settled and remained settled for a while. And that will be contingent on the establishment and successful dissemination of a virus vaccine (or more than one) and of a cure. Once the professional investors have decided that gold has done its job and that it is time for rotation, then gold is likely to come back down to earth, as it did in 2013 with the haemorrhage of 880t from ETFs (36% of holdings at the start of the year), all of which went into the Far east, i.e. mainland China. And silver, which has done its usual trick of watching gold until convinced that the latter is in a bull market, has sprung to life and caught up with a vengeance, gaining 39% since it turned upwards in late June and 29% since the start of its most recent move on 17th July.
Gold ETFs have now added 859t this year, to hold 3,746t, which is currently worth over $230Bn. Global annual jewellery demand over 2000-2018 inclusive (ignoring 2019 as it is such an outlier) was 2,435t so current ETF absorption is running at 62% of that annualised rate.
The momentum will eventually fade, but probably not just yet.

First Chart for the week:
Gold, nominal and real terms (deflator: US CPI). Long term and the major equities markets

Second chart for the week:
Gold and Silver; spot, ratio, correlation
