Jul 2019
Jul 2019
Weekly markets round-up for StoneX Bullion
By StoneX Bullion
Welcome to a very brief overview of the recent performance in the markets. The essentials are captured in the table below and each week we will show a chart of interest.
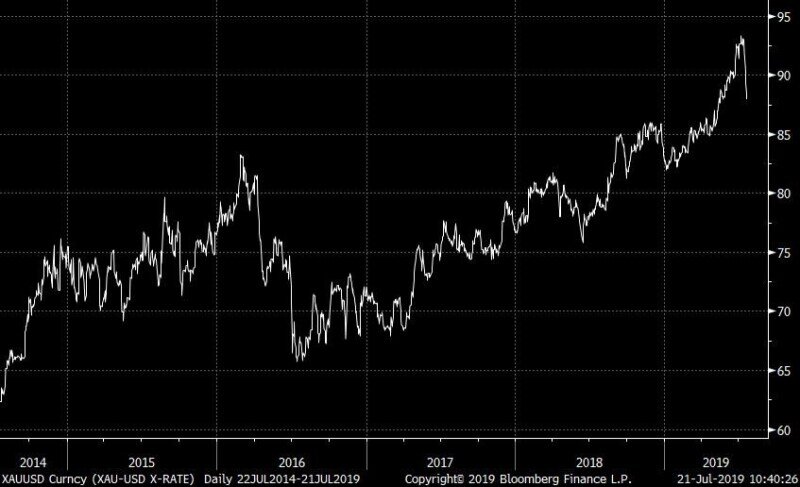
Silver has sprung to life, pushing through resistance at $16 to touch an intraday high of $16.50 on Friday, a 13-month high and taking the gold:silver ratio down to 87.9, well below the recent peak of 93.7, which was the highest since late December 1992. There was no fundamental reason for the move, but it did follow roughly an hour after gold’s push higher (touching a six-year high of $1,452) and it looks as if there was ratio trading involved. Once the move had started, stop-loss orders were triggered and then momentum traders look to have been involved thereafter. Gold’s move was yet again driven by a Fed-watching reaction, allied to increasing tension in the Middle East, and press concentration on the negative bond yields in the financial system, notably in Europe, along with an increasing number of high profile fund managers endorsing gold as a valuable asset class.
On a regional basis physical demand for gold has remained under pressure with India and Dubai both trading at discounts to the international spot price, and the latest trade figures for China show continued reductions in gold imports from Switzerland. There have been suggestions that domestic demand remains strong but that the government has been asking local banks to curb import in an effort to support the yuan; this is certainly a possibility but the approximate value of the gold imported into China last year was of the order of $50Bn against gross import figures of close to $2 trillion, which should put matters into perspective.
Meanwhile the latest figures from the U.S. Mint show sales of Eagles to distributors have remained under pressure with just 3,000 ounces thus far this month, while the monthly average for the first half-year was just over 18,000 ounces against almost 23,000 ounces over 2017 and 2018. Silver coins have averaged 1.7M ounces in the first half-year against 1.4M ounces per month in 2017 and 2018.

Thought for the week
The day that Neil Armstrong took “one small step for a man” onto the moon’s surface gold fixed at $42.00/ounce

Gold : Silver Ratio // five year view