Jul 2021
Jul 2021
Risk-aversion hits silver
By StoneX Bullion
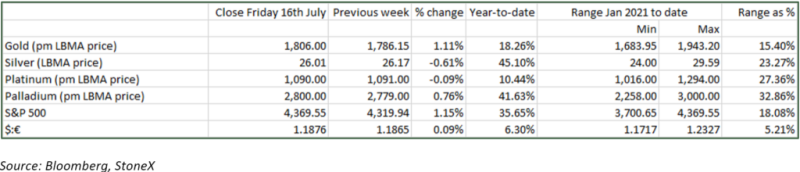
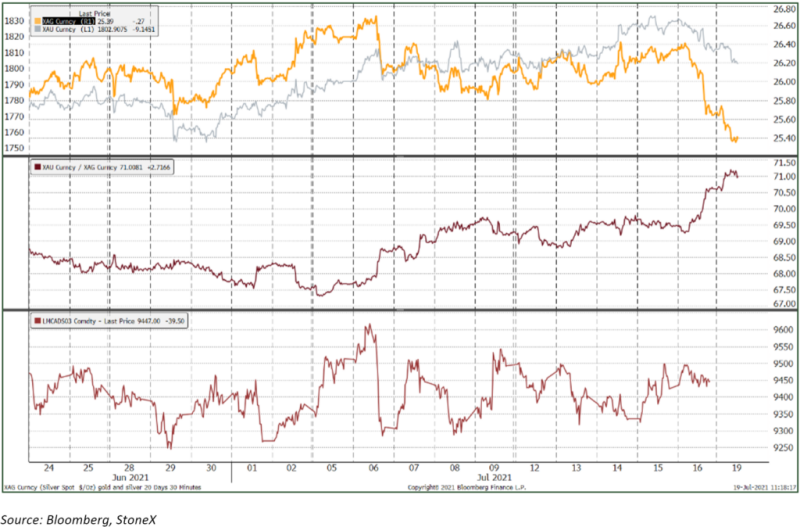
After the washout in mid-June following the Fed’s shift in stance, the bargain hunting that we noted over the following two weeks extended into last week also, taking prices up to a test of $1,830 last Thursday, before running out of momentum. At that stage, based on the technical study Bollinger bands, and to a lesser extent the Relative Strength Index, the market was overbought, so a degree of profit taking developed. The subsequent correction has been shallow, thus far at least and at time of writing the spot price is hovering just above the $1,800 level.
Silver followed gold relatively closely in terms of overall direction but has still been something of a conundrum. The ratio between the two remained steady for much of the week but as gold turned down, so did silver, but more dramatically. We have often noted that silver is more volatile than gold and so the ratio tends to narrow in a bull phase and widen in a bear move, but the underperformance at the end of last week was substantial, with the ratio widening for 69.2 to 71.2 between Friday morning and the time of writing on Monday.
This substantial undershooting is partially reflective of comparatively thin conditions in the northern hemisphere summer, with most of the metals trading relatively sluggishly. Thin conditions usually make for higher volatility and the past couple of days have been no exception. Paradoxically the activity in the Exchange-traded products has seen continued light redemptions in the gold instruments, while silver has been mixed. Over July to date gold has lost 18t, and silver has lost just three tonnes on balance, while the Commitment of Traders report for the week to last Tuesday, when both prices were in the ascendant, was light buying and short covering in gold, and a small contraction on both sides in silver.
The major talk in the markets this morning has reverted to monitoring the spread of the COVID-19 variants and the associated rejection of risk. This has seen some strengthening in the dollar, which has helped to keep the metals under pressure (copper is also easing).
The U.S. Consumer Price index for June was released last week, posting a year-on-year gain of 5.4%, but more significantly with a month-on-month gain of 0.9%. This was the largest one-month gain since June 2008 and the majority of the indices were higher. The core index (i.e. excluding food and energy) was up 4.5% over twelve months, the largest such gain since November 1991. The rate of gain in the Producer Price (factory gate) index continued to accelerate; after a 0.6% gain in April, and a 0.8% increase in May, the June figure was up by 1.0% and was, on an unadjusted basis, up 7.3% over 12 months. The Bureau of Labor Statistics reports that almost 60% of the advance in the June figure could be traced to a 0.8% increase in prices for final demand services.
The Fed remains of the view that these inflationary forces are “transitory” – i.e. reflecting supply bottlenecks as an economy moves from recession to expansion, although Chair Jay Powell did say last week that these forces are stronger than expected. The Fed’s next policy meeting to include economic projections is in the third week of September, so the markets will continue to monitor speeches and presentations from members of the Fed Open Market committee in the intervening nine weeks.
Gold, silver, the ratio, and copper
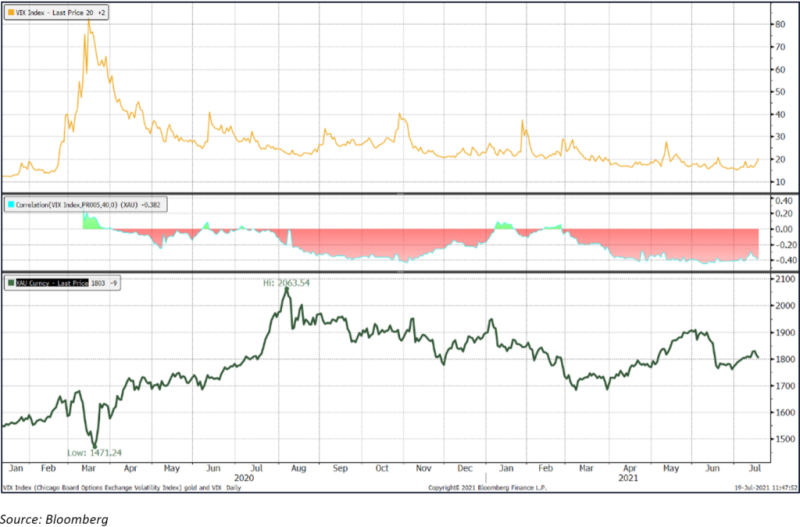
Gold and the CBOE volatility index