Jul 2021
Jul 2021
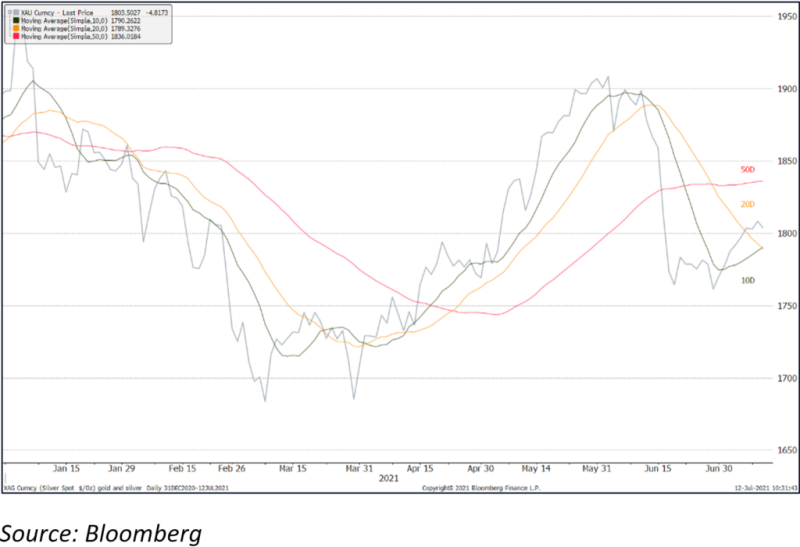
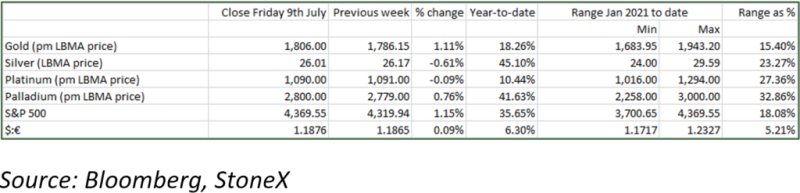
Gold’s technical picture is improving; silver is more sluggish.
By StoneX Bullion
When we last wrote this column a fortnight ago gold and the bond markets had both heavily overreacted to the Statement following the Federal Reserve’s Open Market Committee (FOMC) meeting, with gold prices falling heavily and the bond yield curves initially steepening. It didn’t take very long for the bonds to settle down and the yield curve flattened slightly, while gold’s move had been extended by momentum trading, stop loss activity and other technical factors, to drop to below $1,780.
The bargain hunting that developed has continued both at the professional and the retail level, with professional investors reassessing the shift in the FOMC, which is not as hawkish as at first imagined, and retail buyers responding to the drop in price. South-east Asian activity has been relatively lively and, with the lockdown easing, there are signs of interest reawakening in India, which has had such a tough time over the past eighteen months or so (India is the second largest gold consumer behind China and between 2015 and 2019, Indian gold demand in the form of jewellery plus bar and coin averaged 749t; in 2021 it fell to 446t).
The CFTC figures for the Commitments of Traders help to illustrate the attitudes in the professional sector; in the week to 22nd June the net long position among Money Managers dropped from 301t to 195t under heavy long liquidation and an increase in outright short positions; this has now been partially reversed as bargain hunting has added 66 tonnes, although outright shorts have widened to 166t from 148t a fortnight previously.
The pattern was similar in silver; while the outright gold long positions contracted by 21%, that in silver fell by 22%; here, too there has been some fresh buying interest but rather more moderate; gold outright longs are up 19% but silver, just 8%. Silver is renowned for its fickle nature and is generally speaking more volatile than gold, usually by a factor of around about two times. This past fortnight, however, silver has been well and truly in the doldrums. Since the FOMC meeting silver’s range has been just 4.7% while that of gold has been only marginally narrower at 3.3%.
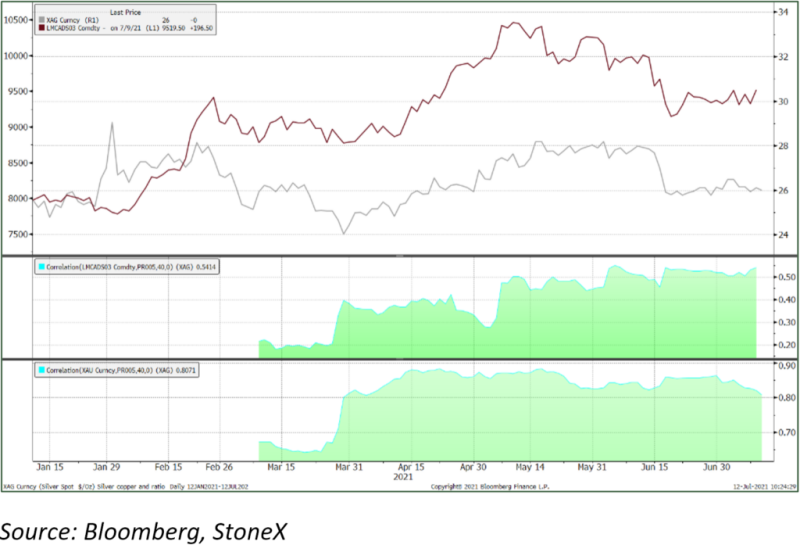
The gold:silver ratio has widened from 66.8 to 69.5 as gold has recovered and silver has been trading broadly sideways. This is due to silver’s dual nature; more often than not when gold is showing a definite trend silver will move in the same direction but more aggressively so, but when gold is directionless silver will often take its cue from copper. Unusually, with gold recovering, silver has been following copper over the past few weeks. The correlation with gold remains the higher of the two, at 0.81 over the past six months against 0.54 with copper, but it is important to remember that correlation does not necessarily equate to direction. It is likely that silver will start to catch up with gold as the markets come to terms with the strong recovery in the United States and the signs of recovery and improving confidence in the EU (and some fresh fundamental interest from India). For now, though, the silver market remains cautious.
Silver: working more closely with copper than with gold;
while gold’s technical picture is improving with the 10-Day moving average challenging the 20-day