Nov 2022
Nov 2022
StoneX Bullion round-up Monday 14th November 2022
By StoneX Bullion
ETFs vs coins; an interesting struggle
Background
Gold and silver both put on a strong bullish performance last week as the dollar, after several months in the fast lane, juddered to a halt (if only temporarily) There is already some talk in the markets about how the long dollar-long yield trade may be coming to an end, but opinions are mixed as to when it will finally call it a day. The actual trigger for last week’s early action, with gold breaking up from $1,675 to test $1,715 came primarily market nervousness about the impending inflation numbers. It is also possible that the markets were feeling skittish ahead of the mid-term U.S. elections
This move took gold even further form its recent downtrend and took it through three key moving averages (10,20 and 50-Day) until it faltered at the 100-Day and stopped to draw breath. One trading house is reported in the press on 8th November (pre-CPI and the day of the elections) as saying that “a million ounces of gold was bought in under two minutes.
At the end of the week gold had hit a high of $1,773, the highest since mid-August and we are approaching the “Golden Cross” in which the 20D average moves above the 50D average, but if this is to happen then prices will need to stay above $1,750 and eke out further gains in the near future, so it is not an inevitability.
Silver, meanwhile, followed gold higher in the early part of last week, but was not quite convinced about gold’s move and the ratio widened from 79.5, where it seems to be finding support, to reach 82.4 at the start of this week, before contracting sharply as silver found support at $21 and launched an assault, thus far unsuccessful, on $22. Gold’s since early last week is 9.5% at time of writing, while that of silver is 16.1%. Normally the beta is at least two, which suggests that the markets are still not totally convinced about the validity of gold’s move – but not far off.
The CPI-related nervousness was borne out when the numbers themselves came through later in the week, with headline at 0.4% month-on-moth, the same as in September, and with core CPI 9i.e. excluding food and energy) at 0.3%, half of the levels of August and September. Year-on=year the headline CPI was 7.8%, down from 8.2% in September, with core at 6.3%, down from 6.7% in September.
It may seem paradoxical that gold rises on cool inflation numbers, given the traditional axiom that gold is an inflation hedge; but in the post-Volcker era, in the United States at least, the perception is not about how gold reacts to inflationary forces, it is about what the financial authorities will do about it. And as we have seen for more than a year now, it has all been about interest rates. Even though real interest rates are largely still negative, especially in Europe, thus quelling the argument about the opportunity cost of holding gold, the belief that the major central banks will do whatever it takes to scuttle inflationary forces has led the professional sector to shy away from gold as an inflation hedge. After all, they have access to TIPS bonds, which are a much better inflation hedge than gold itself, which is an impure hedge, especially in the short term. It is much more effective as a risk-hedge and as a means of expanding the efficient frontier.
The efficient frontier” is the relationship between risk and reward. and has been defined as comprising “investment portfolios that offer the highest expected return for a specific level of risk”. and quantitative analysis has shown that, spending of course on your portfolio balance, adding certain amounts of gold can reduce risk for the same reward, or conversely can increase reward for the same level of risk. This has not been challenged by professional investors, but interest rates are still front and centre and the feeling that the Fed might take a dovish turn sooner rather than later was enough to give gold an upward boost. This was then underpinned by the improvement in technical signals with the short-term moving averages
The start of this week has seen gold unwind part of its overbought position, aided by hawkish comments from Federal Reserve Governor Christopher Waller, saying that the Fed has “a ways to go” before the hiking cycle concludes and that the market was “way out in front” of itself after the inflation members. So, the jury is still out, but the uncertainties in the markets are, for the most part at least, currently working in favour of gold and by association silver since gold has some momentum. Not necessarily outright bullish, but supportive.
Inside the ETFs
These comments are also being published separately on our Market Intelligence Portal and come from an analysis of some of the numbers produced on the World Gold Council’s website, which carries the most exhaustive details available about the gold Exchange Traded Products and their activities.
At the start of the year the combined holdings in gold ETPs were 3,572t for a contained value of $209Bn. At end-October the tonnage was 3,490t, for a contained value $184Bn. The net outflow of funds over the year to end-October amounts to $2.7Bn (based on the daily tonnage change and the London pm auction price).
At the end of last year, the fund holdings were split 50% North America and 44% Europe, with Asia and Others accounting for 4% and 2% respectively. The European investment in the wake of the Ukraine invasion saw inflows of 98t over March and April, slightly lower than in North America, with both regions adding just over 6%.
Since end-April the North American funds have shed 250t and the European, 129t, leaving Europe with a fractionally increased market share of 45% at the expense of Asia.
Within the regions the activity has been mixed with the largest tonnage outflow coming from the SPDR, which is the dominant fund in the sector. In percentage terms the largest outflows, by a long way, came from smaller funds in Canada, which may suggest some switching from ETFs to coins and bars, although the two sectors are more often mutually exclusive, more, or less.
Asian funds have been mixed. Holdings are still very small on an individual basis, although South Africa and Australia, which of course are indigenous gold producers, the combined holdings are 60t.
Smaller holders appear to be the more loyal
In an interesting contrast to this, a couple of the largest overall US gainers in percentage terms year-to-date were the funds aimed at smaller-scale holdings, i.e., the SPDR Gold MiniShares Trust (GLDM, up 20%) and the iShares Gold Trust Micro (IAUM, 26%). Here too, therefore, this points to retail holders investing, while the larger-scale institutional shareholders have been more fluid.
At end October, the GLDM held 89.1t (SPDR, 920t) and the shares are priced basis 1/50th of an ounce of gold. The IAUM is based on the price of 1/100th ounce; and is one of the youngest kids on the block, with an inception date of 15th June 2021. At end-October holdings were 18.8t. As write the GLDM holds 88.7t and the IAUM, 18.7t.
So the funds are telling a mixed story. Large-scale institutional funds’ flows in the face of the long dollar–long yield trade is understandable; while the dynamics among the smaller-denominated instruments suggest that as well as bars and coins, investors are not averse to ETFs, especially given the small size of the denominations.
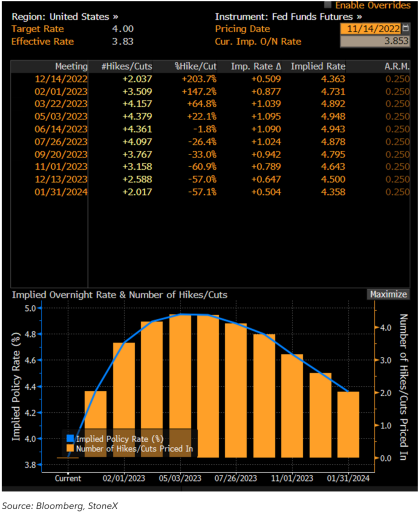
US fed funds rates and projections; peak target now back to May at 4.95%.

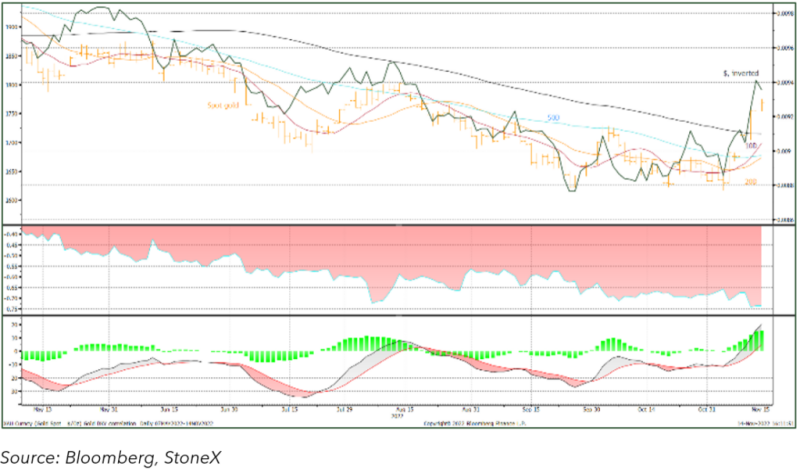
Gold, the dollar and their correlation

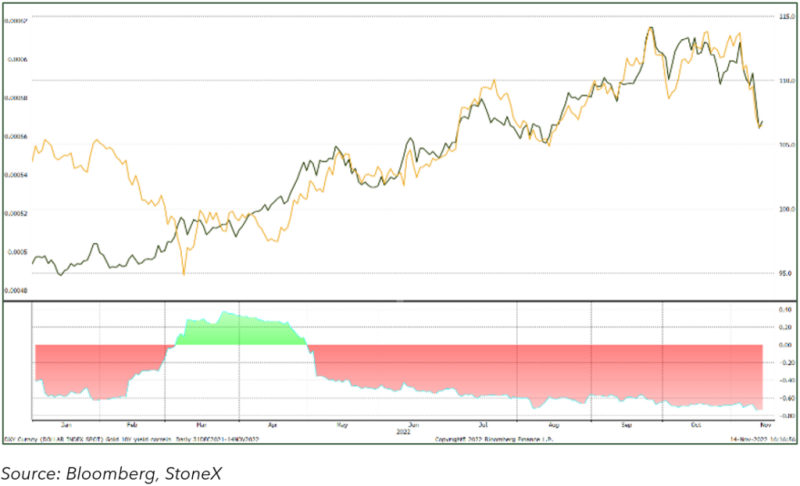
Gold (inverted) and the ten-year yield

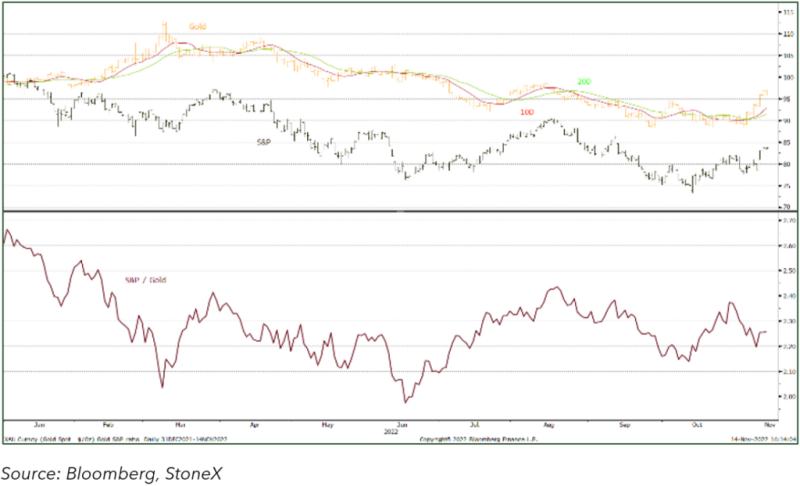
Gold and the S&P; ratio

