Mar 2021
Mar 2021
Weekly markets round-up for StoneX Bullion
By StoneX Bullion
Welcome to a very brief overview of the recent performance in the markets. The essentials are captured in the table below and each week we will show a chart of interest.
Gold has traded in narrow ranges over the past week and although there is a very mild downward bias this looks increasingly like a period of consolidation. The Archegos margin call default is threatening to cause major losses at some investment banks and has put contagious pressure onto the equity markets over the weekend, with the result that gold has come off ever so slightly.
This is perfectly normal. Almost invariably when the equities markets come under pressure gold will come down also. This frequently begs the question : - “if gold is a hedge against risk why does the price fall in times of stress?” The answer is that when other markets are suffering and there is the possibility of margin calls or a loss of liquidity or a simple financial loss, gold is one of the first assets to be sold in order to raise cash and minimise the damage. Historically this was because the majority of equity markets settled in three days of more after the date of the trade (“t+3”), while gold settles in t+2; therefore the sale of gold would generate cash to meet any imminent margin calls. Now, the majority of equity markets settle in t+2 and so that particular argument is irrelevant; but gold remains the primary source of liquidity because it is such a deep and flexible market. Furthermore, as for example in last February and March, gold prices tend to recover more quickly than the other assets.
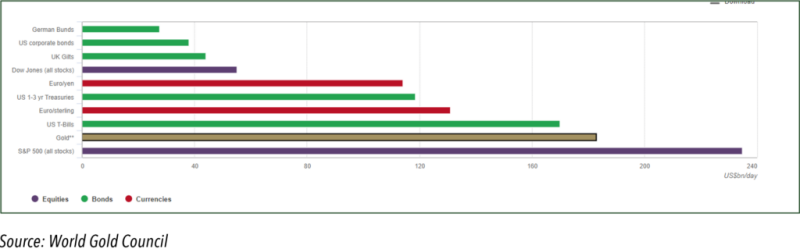
Work by the World Gold Council shows that over the period from 31st December 2010 to 31st December 2020, average trading volumes in gold, including estimates of Over the Counter (OTC) transactions, plus futures and ETF activity, gold stood second behind the S&P 500 at $183Bn per day (S&P 500, $235Bn). If we just take OTC transactions, which may be a fairer way of looking at it, then the estimate for 2020 alone is $110Bn and gold would rank sixth among major asset classes, just behind the euro/yen.
Either way the depth of the market is much greater than its small outright tonnage of approximately 3,500 tpa of physical supply and demand in any one year (at $1,725/ounce, 3,500t of gold is valued at $205Bn; so on that basis in 2020, the overall turnover in the OTC market was 137times the underlying value of the physical demand in the market; including derivatives and ETFs that multiple rises to 227.
This number in and of itself explains, purely on a weight-of-money argument and ignoring external factors, why it is the financial markets that primarily drive price trends in the gold market, rather than the underlying physical. The physical flows are still very important as they define sentiment, can explain levels of tightness, local premia or discounts to loco London and ultimately, as is the case at present, shifts in grass roots physical demand can help to determine trends and inflexion points. Over the past weeks the physical market in the Gulf, and south and south-east Asia, has been strengthening noticeably and while this is not enough in isolation to drive prices higher, it certainly bolsters conditions and can finally feed through into the financial sector – especially if, as recently, there are pockets of tightness in large bar supplies.
Average daily trading volumes across asset classes, $Bn