Jun 2020
Jun 2020
Weekly markets round-up for StoneX Bullion
By StoneX Bullion
Welcome to a very brief overview of the recent performance in the markets. The essentials are captured in the table below and each week we will show a chart of interest.
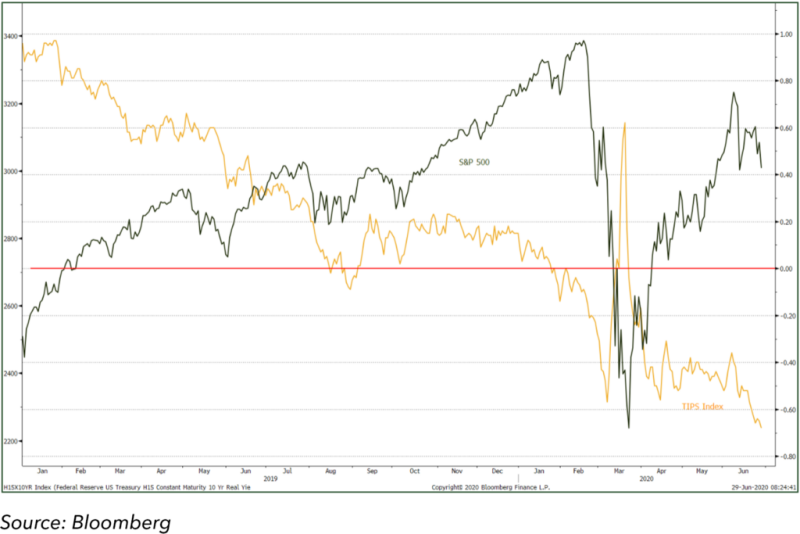
The relentless march of the COVID-19 virus continues to inform the gold market, with prices nudging over $1,770 as the number of confirmed cases passes ten million. The uncertainty that this is generating, the associated fragility of the financial and economic conditions and the massive amounts of liquidity injected by the major central banks are all bolstering gold prices, with negative interest rates still prevalent in Europe and real interest rates negative in the United States. With the exception of the spike in rates in the second half of March as the equity markets fractured, the real rate shown in the chart below has been in negative territory since the end of January.
The physical markets in Asia are quiet all round, while the ETF activity is still vibrant. After a period of profit taking in the first and second weeks of June, buyers have returned and apart from two days of minor attrition the buying has been solid. Over the month to date the net additions to the funds are 81.1t for a dollar-inflow of $4.6Bn and in the year to date, which is effectively the full half-year, the funds have added over 617t. To put this into context, gold mine production over the period would have been roughly 1,700t so the funds have absorbed 36% of global mine production.
Looked at another way, we estimate, based on the World Gold Council’s Q1 figures and anecdotal evidence thereafter, that jewellery and coin & bar demand in the first half of this year are down by roughly 670t. ETF uptake, by contrast, is up by 488t against the first half of last year, so while it has not completely offset the fall, the investor activity in the funds has taken up much of the slack.
What is not quantifiable, of course is the amount of Over the Counter investment in the market, but with several leading fund managers arguing in favour of gold there is little doubt that the uptake has been substantial.
Meanwhile in the United States the U.S. Mint has sold 356,000 ounces (11.1t) of Gold Eagle coins, against 109,000 ounces (3.4t) in the first half of 2019, an increase of 3.26 times. Over the week to 23rd June, during which time gold ran up from $1,719 towards $1,760, outright managed money longs added 80t to 503t, the highest since mid-April, while the outright shorts rose by just three tonnes to 100t, much the same as the prevailing levels over the previous five weeks.
Silver has been unconvinced by gold’s rally and has essentially been moving sideways over the past month, failing so far at $18. This reflects the fact that roughly 52% of silver demand is in the industrial sector and although the base metals markets have been recovering from their heavy falls of March, the uncertainty about the economic outlook is still acting as a drag on silver. This is not to say that it won’t suddenly spring to life, but the prospects for gold are the more solid of the two.
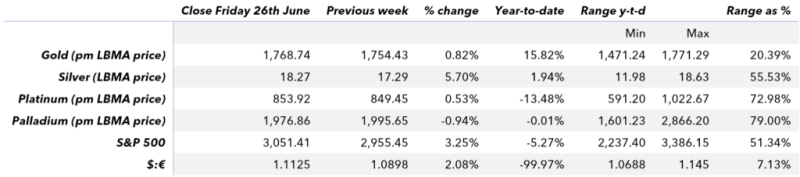
Chart for the week: The U.S. 10-year constant maturity TIPS interest rate (i.e. adjusted for inflation) and the S&P 500.