May 2020
May 2020
Weekly markets round-up for StoneX Bullion
By StoneX Bullion
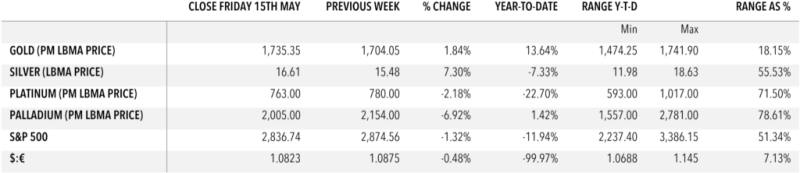
Welcome to a very brief overview of the recent performance in the markets. The essentials are captured in the table below and each week we will show a chart of interest.
In a move that is reminiscent of last May (and indeed of May 2017), gold has been holding to a narrow range of late while price-supportive elements have been building in the back ground; on the charts a triangle formation has been developing (i.e. trading in ever-narrower ranges with declining highs and rising lows). Last year when the price broke higher, the bull run continued until September before a period of respite and then further gains, taking us into the new higher ranges based around initially $1,500 and latterly $1,700.
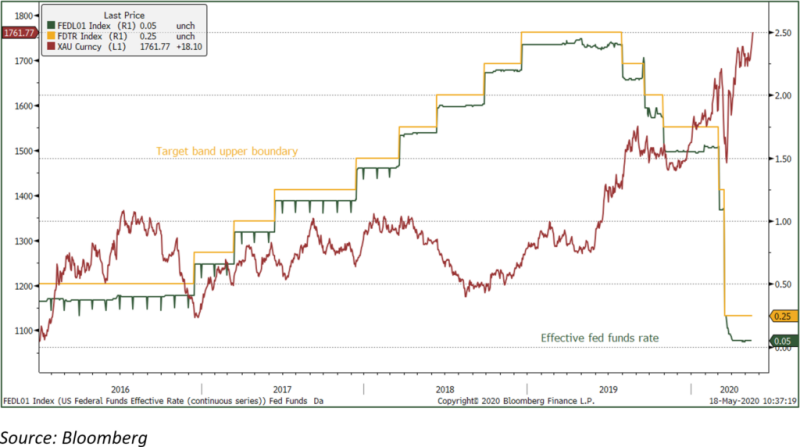
That is not to say that the same thing will happen this time, but the move does reflect a gradual build-up of pressure in the market. The combination of uncertainties over health, economic, financial and geopolitical developments, all of which are of course related, has underpinned gold prices of late in the face of virtually zero demand from the Middle East and Asia (which, on average over 2010-2018 inclusive, accounted for 74% of gold fabrication demand). Now the pressure has come to bear and taken the gold price over $1,760 this morning Monday 18th May. This is the highest since mid-October 2012, a few weeks before gold tumbled on heavy ETF selling in response to the view that gold had fulfilled its role as a risk-hedge in the wake of the Lehman crisis and portfolios were rebalanced. One key psychological element this time is the market chatter about the possibility of the United States federal funds rate (the overnight interest rate) going below zero, which is something that the Federal Reserve Board does not want to happen. The Chairman of the Fed, Jerome Powell, delivered an important address last week in which he underlined this point, but the low level of the rate and the possibility of it moving into negative territory, has certainly helped to fuel the fire underneath the gold price.
This time we are encountering a wave of heavy ETF purchases. With the exception of one day (23rd April), the gold ETFs have now enjoyed 40 consecutive days of gold ETF creations, for a net addition of 341 tonnes. Over that period, that is the equivalent of two-thirds of world gold mine production and involves the net investment of $18.3Bn. The fund holdings, as reported to Bloomberg (slightly less than the totals recorded from individual funds by the World Gold Council), now amount to 3,068 tonnes, for a year-to-date increase of 489t and a current value of $174Bn. That is equivalent to slightly more than the GDP of Hungary.
Thought for the week
The World Gold Council figures for 8th May show ETFs now holding more gold than Germany; in other words, if they were a central bank they would be the second-largest holding in the world.
Chart for the week
Gold and the U.S. federal funds rate