Sep 2019
Sep 2019
Weekly markets round-up for StoneX Bullion
By StoneX Bullion
Welcome to a very brief overview of the recent performance in the markets. The essentials are captured in the table below and each week we will show a chart of interest.
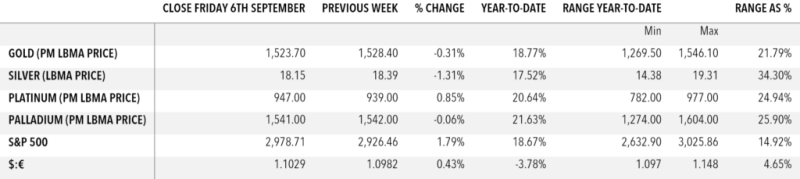
A lively week last week with the precious metals all driving higher before the inevitable correction set in. Taken in isolation the bullish silver move in particular, with the price scorching its way up to more than $19.50 on 4th September, looks vicious (which it was) and out of character (which it is not). Silver often behaves like this, with very sharp moves in both directions. It is well understood that silver is a volatile asset and as a result a number of speculators and some investors will add leverage to their gold exposure by adding silver to their positions, which means that this volatility feeds on itself. Silver has generally followed the overall trend in gold over the past five years, and there is also ample evidence that silver has a much higher correlation with gold than it does with copper. As we noted last week, in the first few months of this year, when gold was trading in a very narrow range, silver trended lower in company with the base metals sector and the gold:silver ratio widened to touch a 26-year high of 93. It narrowed to below 79 on 4th September but as gold, silver and platinum corrected in a bout of heavy selling, much of which would have been technically driven with stops being hit, the ratio moved out to 83.
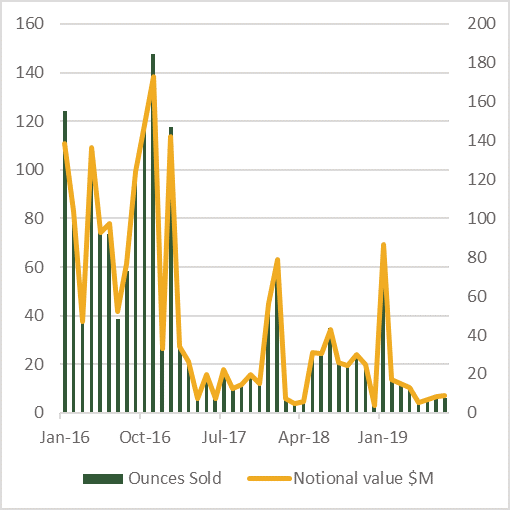
The latest figures from the United States Mint show sales of American Eagle gold coins were 121,000 ounces over January-August compared with 177,000 over the equivalent period of 2018. There is a partial price-elastic issue here with sales dropping off substantially from May onwards as prices rose. The charts here show for both gold and silver the notional value of the gold and silver sold in these coins; This is perforce an approximation as it takes the monthly totals and average prices rather than daily, but it does at least give an order of magnitude in terms of expenditure. Notional expenditure actually dropped off in May, before the gold price started moving, but remained low thereafter, averaging $8.2M in June-August inclusive, compared with an average of $33M per month in June-August 2018.
The story with silver is rather different, however with sales rocketing in the past three months as the silver price took off. This is a reflection of the American love for silver and while the actual level of expenditure is an order of magnitude lower than the expenditure on gold, the purchase patterns reflect how silver can capture the imagination of retail clients. There is also the important point that silver is a lot cheaper than gold and therefore in some ways more accessible.
The attraction of silver in its own right is also borne out by the fact that the numbers of fractional gold coins (i.e. half– quarter- and tenth-ounce denominations) did not rise during the June-August period. In fact no tenth-ounce coins were sold at all during August. We have noted the history behind the relationship between gold and silver and the Americans’ proclivity to buy silver; when the dollar was on the gold standard during the Bretton Woods era private citizens were not allowed to hold gold as an investment item and so they turned to silver as an able substitute.
N.B. Do not be misled by the strong sales in January. This is because these numbers (for the whole year) reflect the gold and silver sold to coin dealers rather than overall outright point-of-sale transactions and January sees heavy metal allocations.
Thought for the week
The world’s largest consumer of silver overall, and in jewellery and coins and medals, is India
Chart for the week
Gold and Silver Eagle sales, January 2016 to August 2019