Oct 2021
Oct 2021
Still sideways in stagnant conditions; inflection point coming
By StoneX Bullion
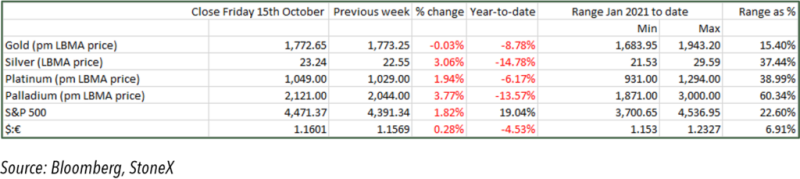
When we last wrote a fortnight ago gold was trading between $1,750 and $1,760, having rallied from lows in the region of $1,720. Since then it has traded between technical indicators, albeit with a mild upward bias. Dollar movements (tied in with bond yields), as is so often the case when external forces are muted, have been key, although the correlation between gold and the dollar has been lower than usual. We should point out here, though, that correlation does not necessarily equate to direction.
Direction, indeed, is what the price is lacking at the moment. As the chart below shows, the spot gold price is currently clashing with the ten-day moving average, gaining support from the 20-day and meeting nearby resistance from the 50- and 200-day averages, reflecting the narrow ranges of the past month. The lower chart shows how a triangle formation is developing; with the apex currently pegged at $1,788 for the end of this month. Given the congestion of the moving averages, a break-out in either direction would be underpinned by all the major moving averages being either above or below the spot price.
Meanwhile COMEX volumes have been low, although the Managed Money positions showed a bullish tone in the week to 12th October, a week in which the gold price had been trading more or less sideways. There was some light fresh interest from the long side, but more sizeable, short covering. Exchange Traded Products are currently mixed. All of this suggests that we are approaching an inflection point,
The seemingly never-ending media discussions about the Fed’s tapering programme suggests that tapering must be priced into gold by now. Experience also suggests, however, that whatever the outcome of the next Federal Open Market Committee meeting (which is on 2nd and 3rd November), there will be a knee-jerk reaction in the gold market, which we would expect to be short-lived, by definition.
So what should the direction be thereafter? The bullish arguments, in our view, outweigh the bearish considerations. The potential for renewed dollar strength and a steepening yield curve would be bearish, but the excess liquidity in the financial system, a lot of managed money looking for a home, the persistence of negative real interest rates (and negative nominal rates in many European countries) is a key supportive factor. The debate continues to rage as to whether inflationary forces are transient or becoming more persistent; if transient, then interest rates will stay lower in a continued effort to boost economic activity; if inflation becomes more permanent then rates may rise (but in real terms they will fall). While we have seen a strong rebound in economic activity, though, supply bottlenecks are still making the global recovery uneven (especially freight and semiconductors, which influence much industrial activity) and the virus, of course, is still causing issues especially in parts of south-east Asia. Central banks have little room for manoeuvre and the last thing they will want is to choke off the recovery because although it appears to be strong, it is still fragile.
Although September U.S. retail sales were better than expected (at 0.7%) and helped to put some pressure on gold towards the end of last week, the uncertainty surrounding the outlook for economic activity and monetary policy is supportive for gold. They do not necessarily point to a strong bull market, but underline gold’s role as a mitigator of risk. As far as external shocks are concerned, a fracturing in the equities markets would be negative in the short term but beneficial for the longer term.
Gold and the inverse of the dollar, along with key moving averages
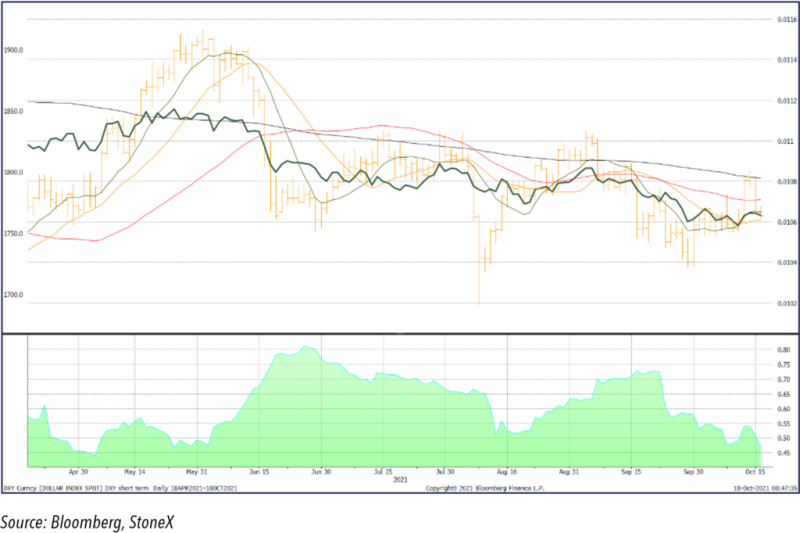
Gold; triangle formation forming – potential breakout
The Fed’s dot plot, June (left) and September (right)
...
Source: Federal Reserve Board