Gold’s intraday range in the third quarter was even narrower than that of the second quarter, between $1,832 on 4th August, to the quarter’s low of $1,691 just three trading days later for a range of 8%.
That of silver, in keeping with its more volatile nature, was much wider at 40%, between an intraday high of $26.77 and the low, at the end of the quarter, of $21.42.
Over the quarter as a whole, gold opened at $1,770 and finished at $1,757, virtually unchanged for a small loss of just 1%. Silver opened at $25.77 and closed at $22.17 a drop of 14%, before a rally in early October.
Once again, the key themes running through the markets were the outlook for inflation in different regions, whether it would be transitory or persistent, whether it was a friend or a foe and what central banks would do with their monetary policies. Woven through this was the continued issue with supply chains as the virus took hold again in the Far East and shipping rates continued to rocket with vessels lying anchored offshore all round the world as it was so difficult to disperse goods once onshore. By the end of the quarter this was feeding into the silver market, with some silver now being flown to its destination as opposed to the more normal seaborne routes (gold is almost always flown so this was not an issue). Silver became difficult to come by in places and this was the constraint in coin sales in September (all major Mints went onto allocation) and as we moved into October it was also becoming difficult to keep up with demand for small bars. Silver Eagles sales from the U.S. Mint in the quarter amounted to 9.8M ounces (for $234M), a 47% increase in tonnage over Q3 2020, for an increase in contained value of 39%, reflecting the strength of demand before tightness began to hit. Gold Eagle sales reached 8.4t for expenditure of $484M, a tonnage increase of 16% and just 6% up in dollar terms.
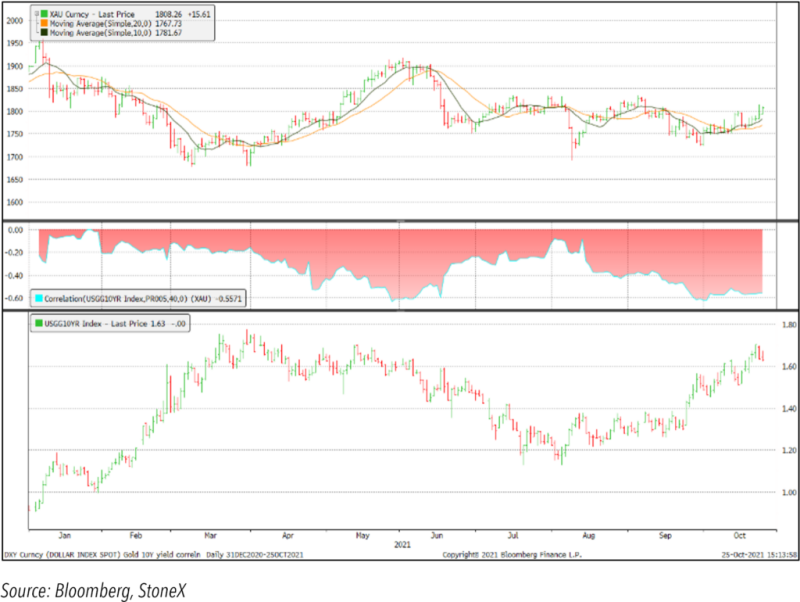
Gold and the ten-year yield
In terms of the professional market dynamics, the international hunt for yield and reliability saw steady flows into U.S. Treasuries and this gave the dollar support that tended to cap advances in the gold price. Gold’s sharp fall in the early part of August didn’t have any readily identifiable trigger from economic forces, but was widely thought to have been due to a fund or funds switching out of gold and into Treasuries; it coincided also with the “Death Cross”, a chart construction in which the 50 day moving average crosses below the 200-day average – and then of course momentum players and stop loss orders will have been triggered. Spot volumes did indeed balloon, but the fact that this was not reflected in the forwards and lease markets does suggest that this was something of an anomaly and not accompanied by, nor caused by, any fresh hedging activity.
August also saw gold concentrating on economic policy statements, with Fed Chair Jay Powell addressing the Jackson Hole economic symposium (still holding to his “transitory” definition of current inflationary forces) along with an increasing number of Federal Open Market Committee officials delivering hawkish views. Prices recovered over the rest of the month on the back of bargain hunting (in the retail market as well as professional), although trading patterns would suggest that once gold regained the $1,800 level in September some mine hedging may have appeared. Early September saw fresh erosion in the price despite dovish sounds coming from some FOMC members, countering the hawkish views of their colleagues; the primary influences here were renewed dollar strength as it rebounded after taking a thumping on the back of employment figures that were way below expectations. Gold weakened further in mid-month head of the FOMC meeting in the fourth week and seemed to be ignoring any possible contagion from the Evergrande problems into the international market.
The FOMC meeting yet again generated a knee-jerk down-draught in gold despite coming in as expected, with the market taking note of the “Dot plot”, which saw more FOMC members expecting interest rate hikes in 2022 and 2023. The FOMC Minutes remained in the transitory camp, however, expecting Personal Consumption Expenditure to moderate from over 4% this year to 2.2% next. It therefore looked as if weak-handed holders were exiting gold in September, laying the foundations for the early October rally.
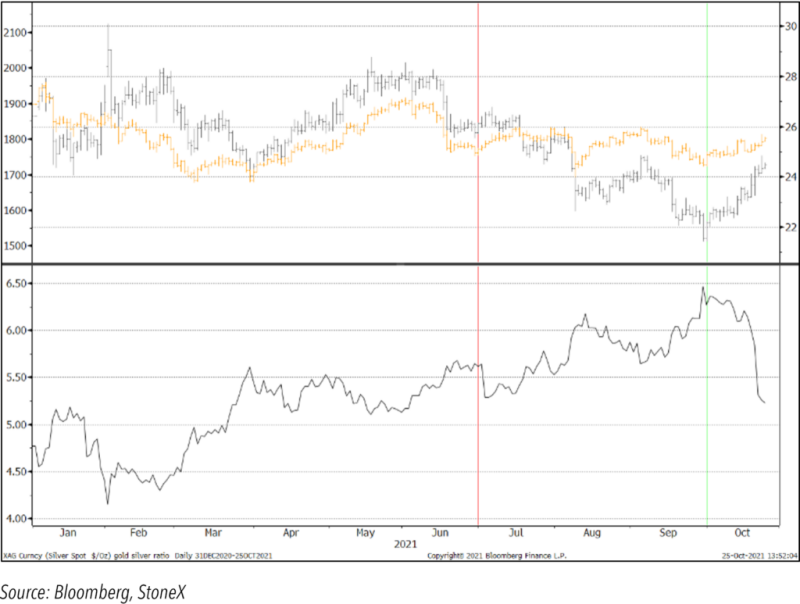
Silver generally underperforms when gold is meandering and this was definitely the case in the third quarter as silver looked away from gold towards an uncertain economic outlook (bear in mind that 60% of silver demand is industrial; also that the vast majority of supply keeps on coming regardless of conditions, because it is price inelastic and dependent on mine plans for lead-zinc, copper and gold as to 70% of its mine supply, plus industrial scrap return). Silver trading was also pretty strongly dictated by technical signals and in mid-September it certainly looked as it the $25 level was attracting forward and options activity. This halted the price rally; and as gold was also slipping and technicals were deteriorating silver found itself in a one-way street and dropped to below $22.
As a result the ratio (see the first chart) reached 80n by late September, although it subsequently contracted as the two metals enjoyed a rally in early October.