Oct 2021
Oct 2021
Gold treading water, but with an upward bias
By StoneX Bullion
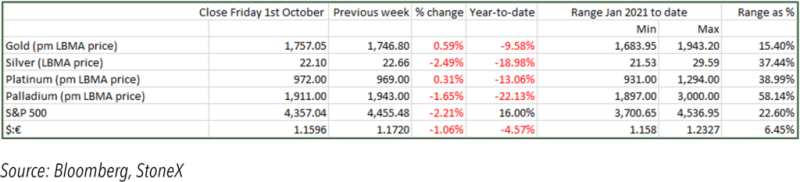
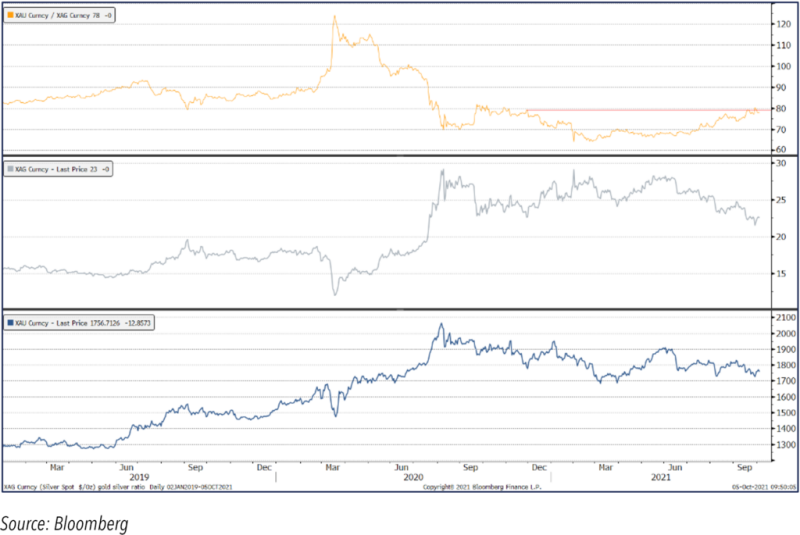
Gold has traded in a narrow range since our comments of a fortnight ago, with a low LBMA afternoon auction price of $1,733.75 and a high of $1,774.45, just 2.3%. On an intraday basis the range is obviously wider, between $1,722 and $1,770. The change over the period (LBMA auction price basis) was minimal, a fall of just 0.04%. Silver, meanwhile, has regained a degree of poise, adding 35 cents, or 1.6%, to $22.62. The ratio has effectively held steady, bumping up once or twice against 80, but this offered resistance and the ratio is hovering just below it as we write.
Gold, Silver and the Ratio
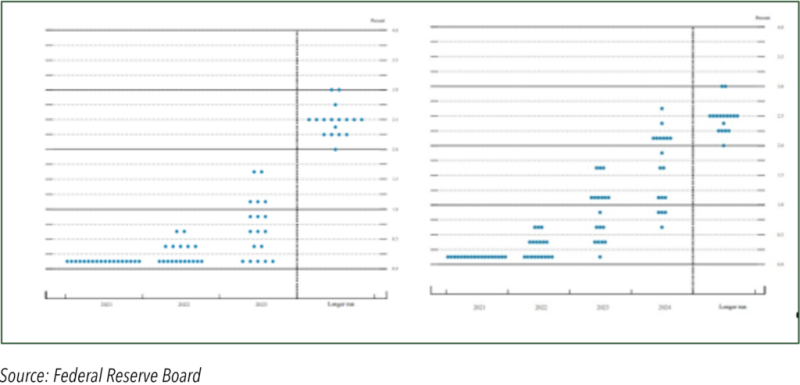
The outcome of the most recent Federal Open Market Committee (FOMC) meeting was broadly as expected; the median forecast for the Personal Consumption Expenditure rate (this is the inflation gauge that the Fed watches most closely) is for 4.2% this year, but moderating to 2.2% next year, with the projections for Core PCE at 3.7% and 2.3% respectively. So although there have been increasingly hawkish comments from a number of members of the FOMC, and while recent economic numbers from the United States could have been interpreted in a hawkish manner, the Fed is still only too aware of the risks of derailing the economic recovery, especially when the delta variant remains lively and unemployment is still high (despite shortages in certain sectors).
The Fed’s view is that Inflation is likely to remain elevated before upward pressure moderates; bottlenecks are still restricting the potential to respond to strong demand – and they have been larger and longer than anticipated, hence the upward revision to inflation. Bottlenecks, hiring difficulties and other constraints could again prove to be greater and longer lasting than anticipated. In response to a question on inflation during his post-meeting Press Conference, Mr. Powell pointed to the forecast “very modest overshoot” two and three years out (2.1 and 2.2% vs 2% target) and he believes they are very much on track to achieve the average 2% target. The ultimate test is anchoring inflationary expectations at 2% over time.
As far as interest rates are concerned, the criteria that apply here are different from those for tapering. Half the Committee thinks that the right conditions for interest rate lift-off will be in place by the end of next year, but this is not a firm forecast. Either way the interest rate outlook in the United States remains benign for the time being.
Meanwhile investor activity remains very cautious from the institutional side. The fundamental background remains supportive, including persistently low nominal interest ates, and negative real rates across most nations, the potential for further fall-out from the Evergrande difficulties, and inflationary forces; although the debate over whether inflation is transitory or persistent does still seem to be favouring the “transitory” argument. We would still argue that a little inflation is a good thing as it helps to encourage spending and investment; it is only when inflation becomes a threat that gold comes into its own in this particular respect. The primary headwind is the Fed’s plans to start tapering, which reduces economic stimulus and could therefore reduce investor interest. The latest ETP figures show that since the start of September 26t of gold left the Products, for a net dollar outflow of $1.4Bn. As we write the overall holdings are 3,585 tonnes, equivalent to just less than one year’s global mine production. The silver ETPs, which tend to be more retail-investor oriented, have also lost metal, but to a much lesser extent; net outflows since the start of September were just 20t, leaving the total at 28,434t, equivalent to fourteen months’ global mine production.
Flows through COMEX gold (fund investors, generally) show that in the final three weeks of September, outright shorts increased from 185t to 274t, the highest since June 2019, and six standard deviations away from the average of 168t for the year to the previous week. This may well mean that the rally from $1,724 to $1,770 over the past three days was driven by short-covering, especially as it looks as if the on-the-ground physical private purchases have been on the rise.
The Fed’s dot plot”, June (left) and September (right)