Nov 2022
Nov 2022
StoneX Bullion round-up Monday 7th November 2022; slight confusion over Fed messages
By StoneX Bullion
Background
We noted last week that disappointing US economic numbers had raised talk of a Fed pivot sooner rather than later and that the markets had reacted accordingly. The initial reaction to the Fed statement on Wednesday last week, following the Committee’s two-day meeting, saw gold spike higher and the dollar drop sharply, as it looked as if there was indeed going to be some flexibility with a bias towards the dovish side.
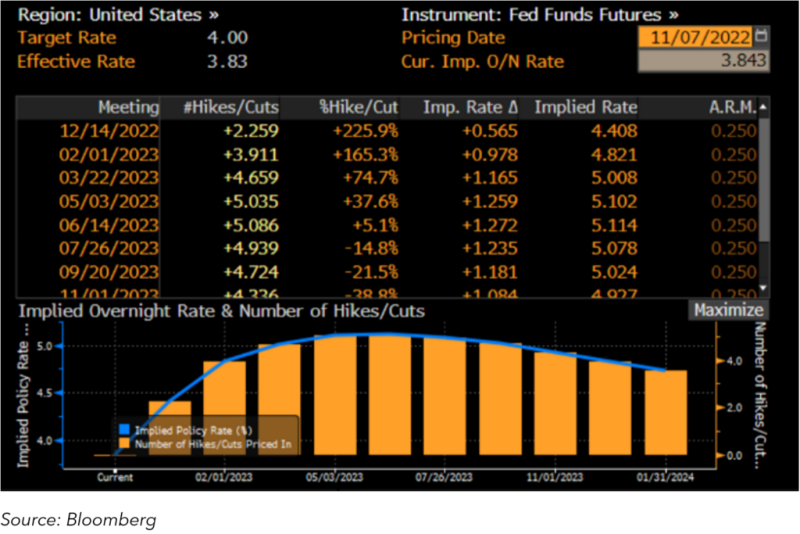
Fed Chair Jay Powell put paid to that very quickly in his Press Conference and as we write almost a week later the bond markets are currently pricing in a 60-basis point interest from the current effective rate of 3.83%, so we are now almost back in the same position as a week ago, with a 70% probability of a 75-pwirpoint hike. The difference though is that the market is now expecting the peak to be in June, whereas a week ago the target peak was May. The market is discounting a peak of 5.1%, which still looks too benign; at least one Fed official is postulating a terminal level of 6%.
The essential difference between the November statement and those that preceded it was the addition of the assessment of the “cumulative tightening of monetary policy” and the lags with which monetary policy affects economic and financial developments.
This was the cue for the markets to expect a softer stance, until Chair Powell restored the status quo. Probably the most revealing comment came in response to a question (as is so often the case), as follows:
“There will be “tons of confusion” out there about the size of the next hike – can you say which way the bias will lie?”
The answer as along these lines:
I will put the question of pace into the context of our broader tightening programme: the programme addresses three questions – a) how fast to go? b) how high to raise the policy rate? c) how long to remain at a restrictive level? [this wasn’t answered as there was an intervention].
a) this year's historically fast pace.is “certainly appropriate”
b) the policy rate needs to be the level that levers inflation down to 2%; there is some ground to cover before we get there. Incoming data – labour and especially CPI - suggest that they may move to a higher level than projected at the September meeting. The time to slow increases is coming; maybe December or the following meeting”. This will be discussed in December.
Don’t forget about China
Shanghai Shenzhen index; the HK & Shanghai property index
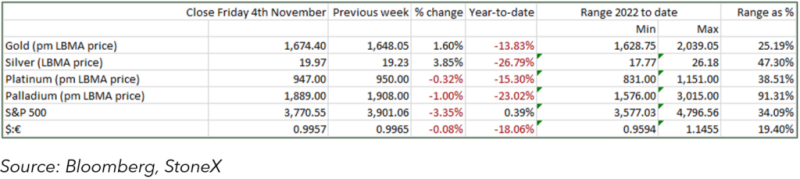
By the close of the New York trading day after the FOMC meeting, gold was trading in the $1,635 region, lower than when the day had opened. There was some further slippage as the dollar strengthened on the Thursday, but conditions have changed since, and as we write the dollar is at week-long lows. The initial force behind this appears to be the resurgence in Chinese equities last week, on the back of a rumoured re-opening of the country, a change in direction from the lockdown policies implemented thus far. (This was only a rumour, and the country is awaiting a report that is due to be released by the Chinese authorities this Wednesday 9th November).
… and back to the States
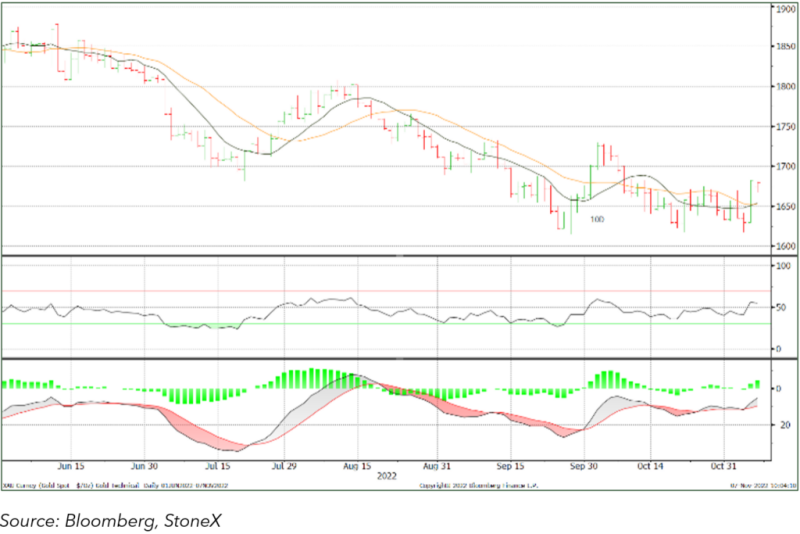
The U.S. employment numbers, released last Friday, were mixed, with a rise in unemployment, although hiring and wage increases were both strong and this prompted a sharp drop in the dollar as it rekindled talk of a pivot; gold responded accordingly and tested three-week highs at $1,685; as we write prices are looking to stabilise. The technical picture is improving, with the 10D moving average about to cross the 20D to the upside.
Silver has outperformed gold, as is the usual pattern when gold is showing a defined bull trend, with the ratio closing down to 81, having been over 90 in mid-October; the ratio is now at its lowest since late April.
US fed funds rates and projections
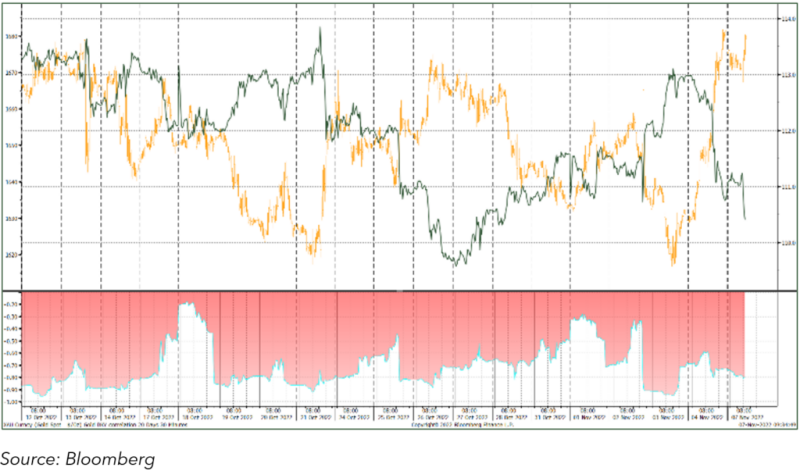
Gold, the dollar and their correlation
Gold and Silver, 2022 to date

Source: Bloomberg
Market developments
- The gold Exchange Traded Products are still losing metal. Since the start of July, over 91 trading days there have been just eleven days in which there have been net additions and the year-to-date change is a reduction of 105 tonnes. The transparency of these numbers can affect market sentiment and it is certainly possible that this is happening now.
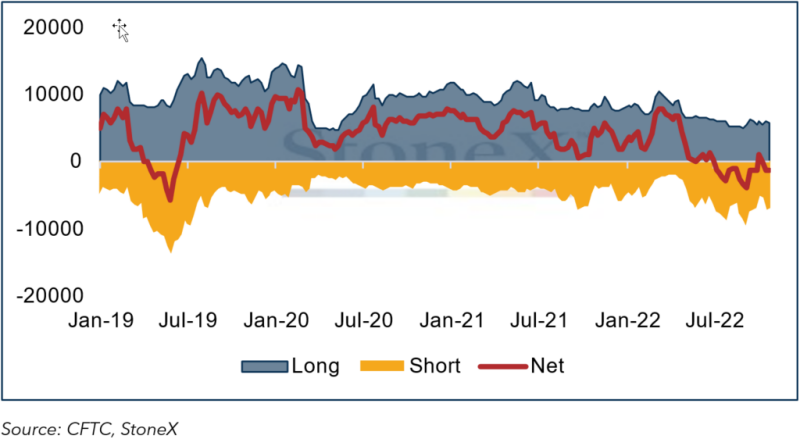
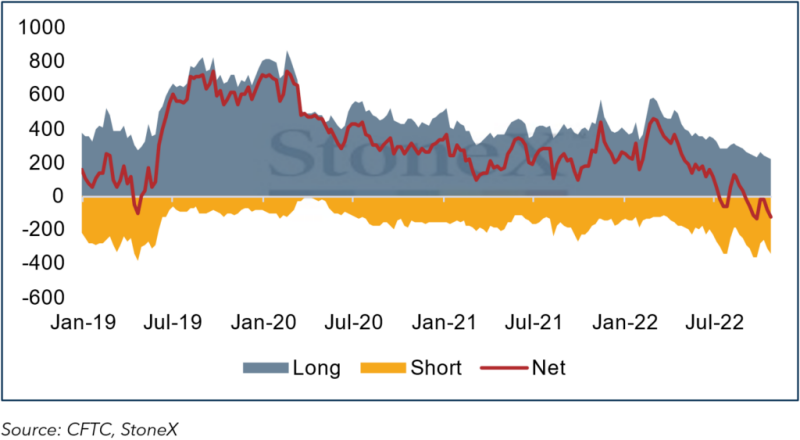
- In the seven days to1st November, the most recent reporting date from the CFTC, gold had eased towards $1,630 before finding some support. Activity on COMEX suggested bargain hunting, but there was also further short-side activity. The gross long increased fractionally, from 224t to 243t, while shorts expanded from 345t to 372t, the largest since late April 2019. This has taken the net short to 129t, compared with a12-month average of 1,915t long.
- In the same period, silver saw a 96t increase in longs to 5,791t and a 96t reduction in shorts to 6,665t, taking the net short down to 874t against a twelve-month average of a 1,915t long.
- Meanwhile since end-September gold open interest on COMEX has continued to increase, while inventories are now at 765t, comprising 52% of total open interest. In the silver contracts, open interest has slipped slightly to 21,572t (a year’s global industrial demand is roughly 26,000t); inventories, at 9,343t, are down by 25t and still comprise 43% of total open interest.
Key charts
Gold in dollar terms, year-to-date; technical indicators. Consolidating and the technical indicators are improving
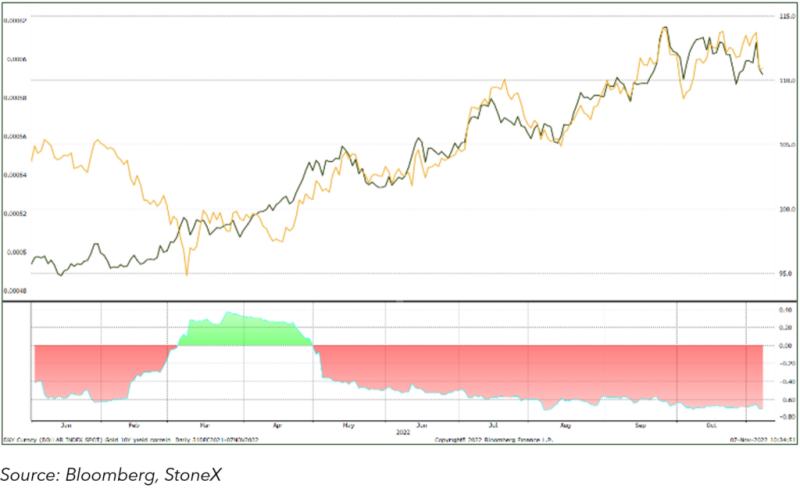
Gold (inverted) and the ten-year yield
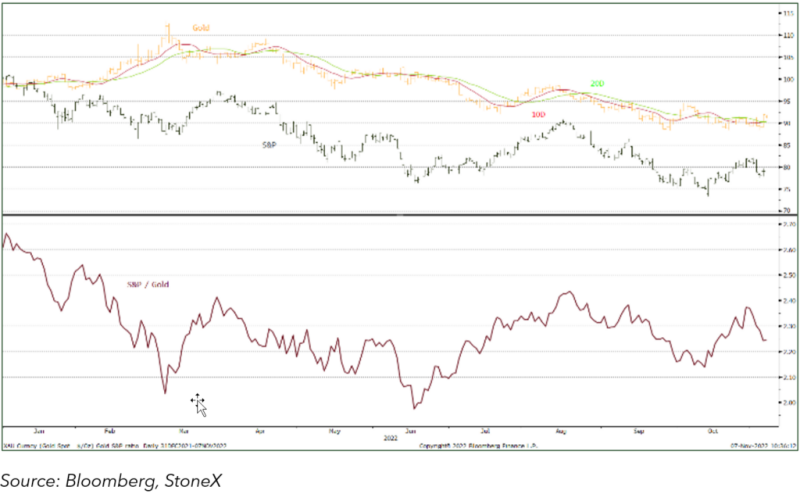
Gold and the S&P; ratio
Gold and silver COMEX positioning, tonnes
Gold: -
Silver: -